New report filters in the Advocacy Platform
New report filters in the Advocacy Platform
By Shannon May
Product Marketing Manager at ExpertVoice
August 13, 2021

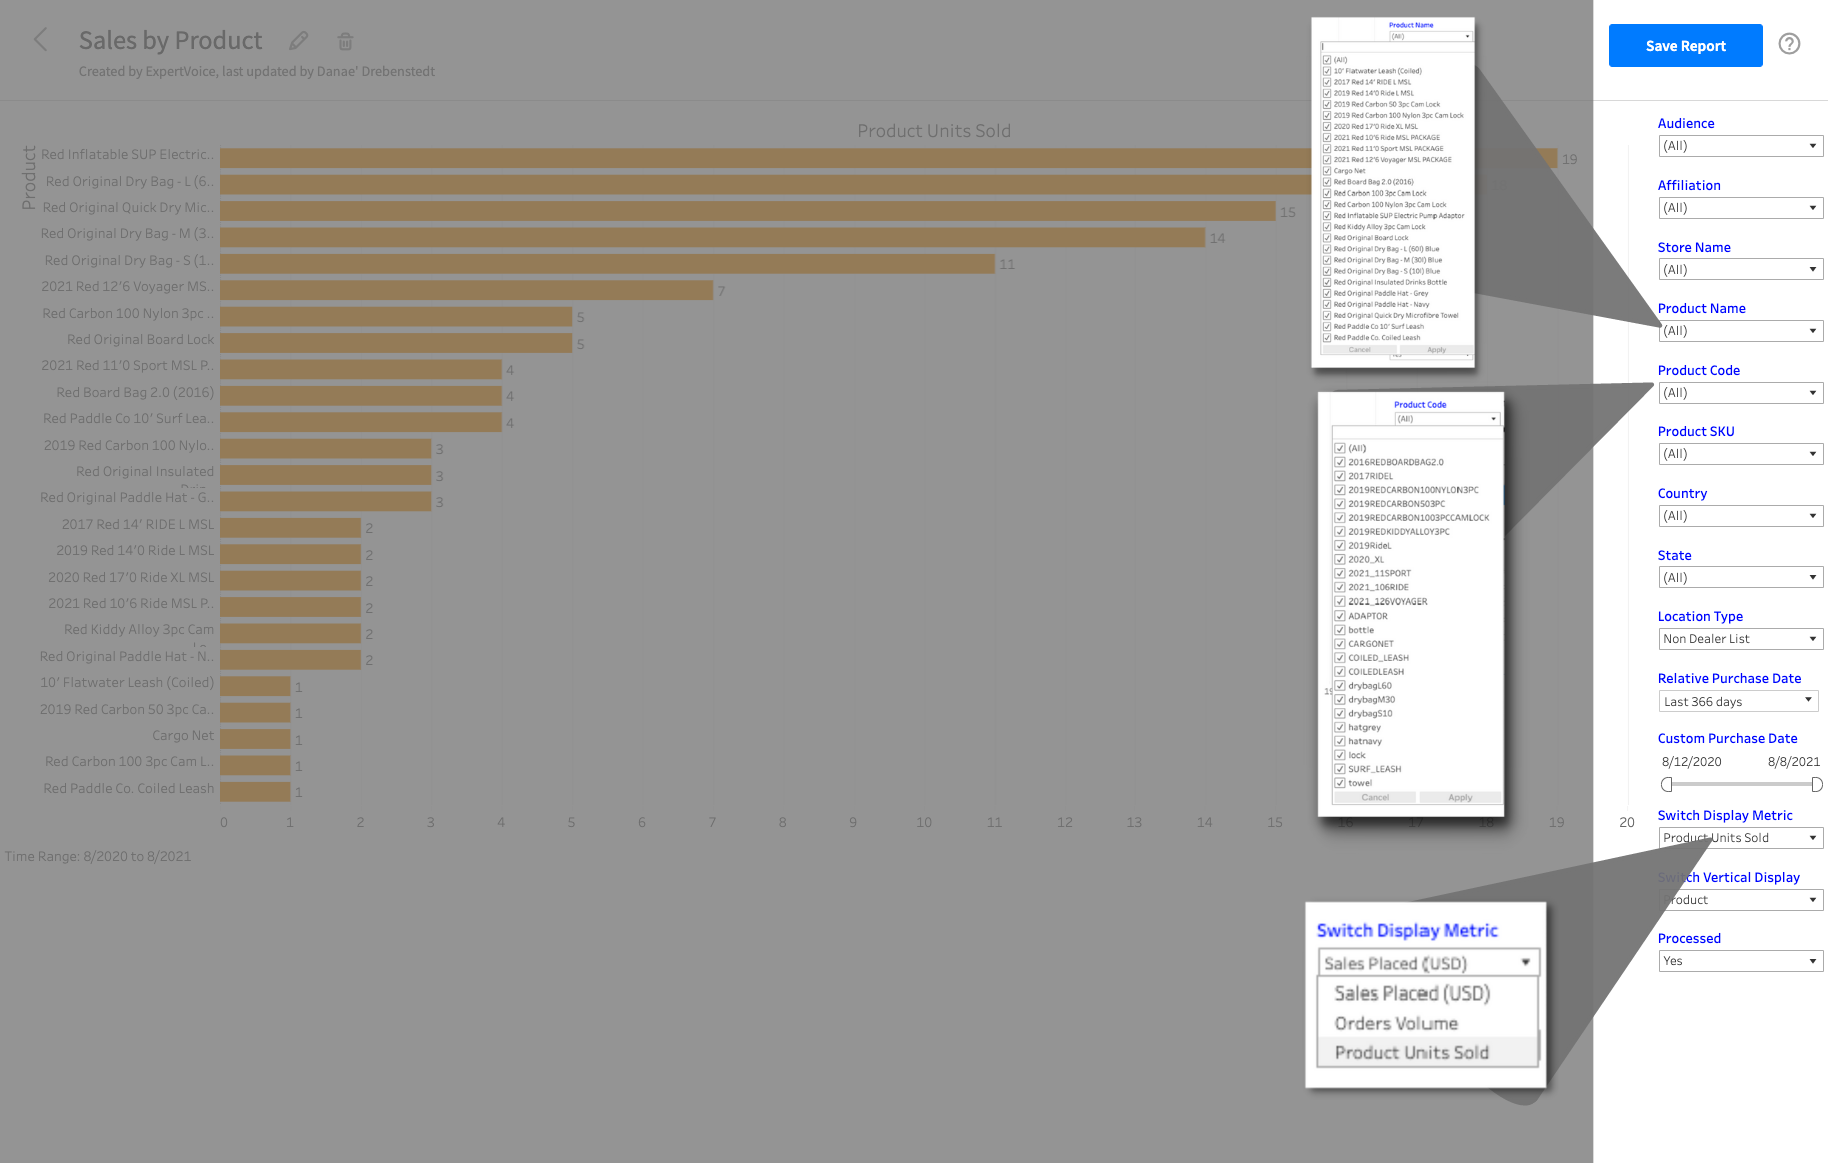
Sales by Product Report
What it is: New filters in the Sales by Product report of the Advocacy Platform allow you to better view your total sales over time for specific products on ExpertVoice.
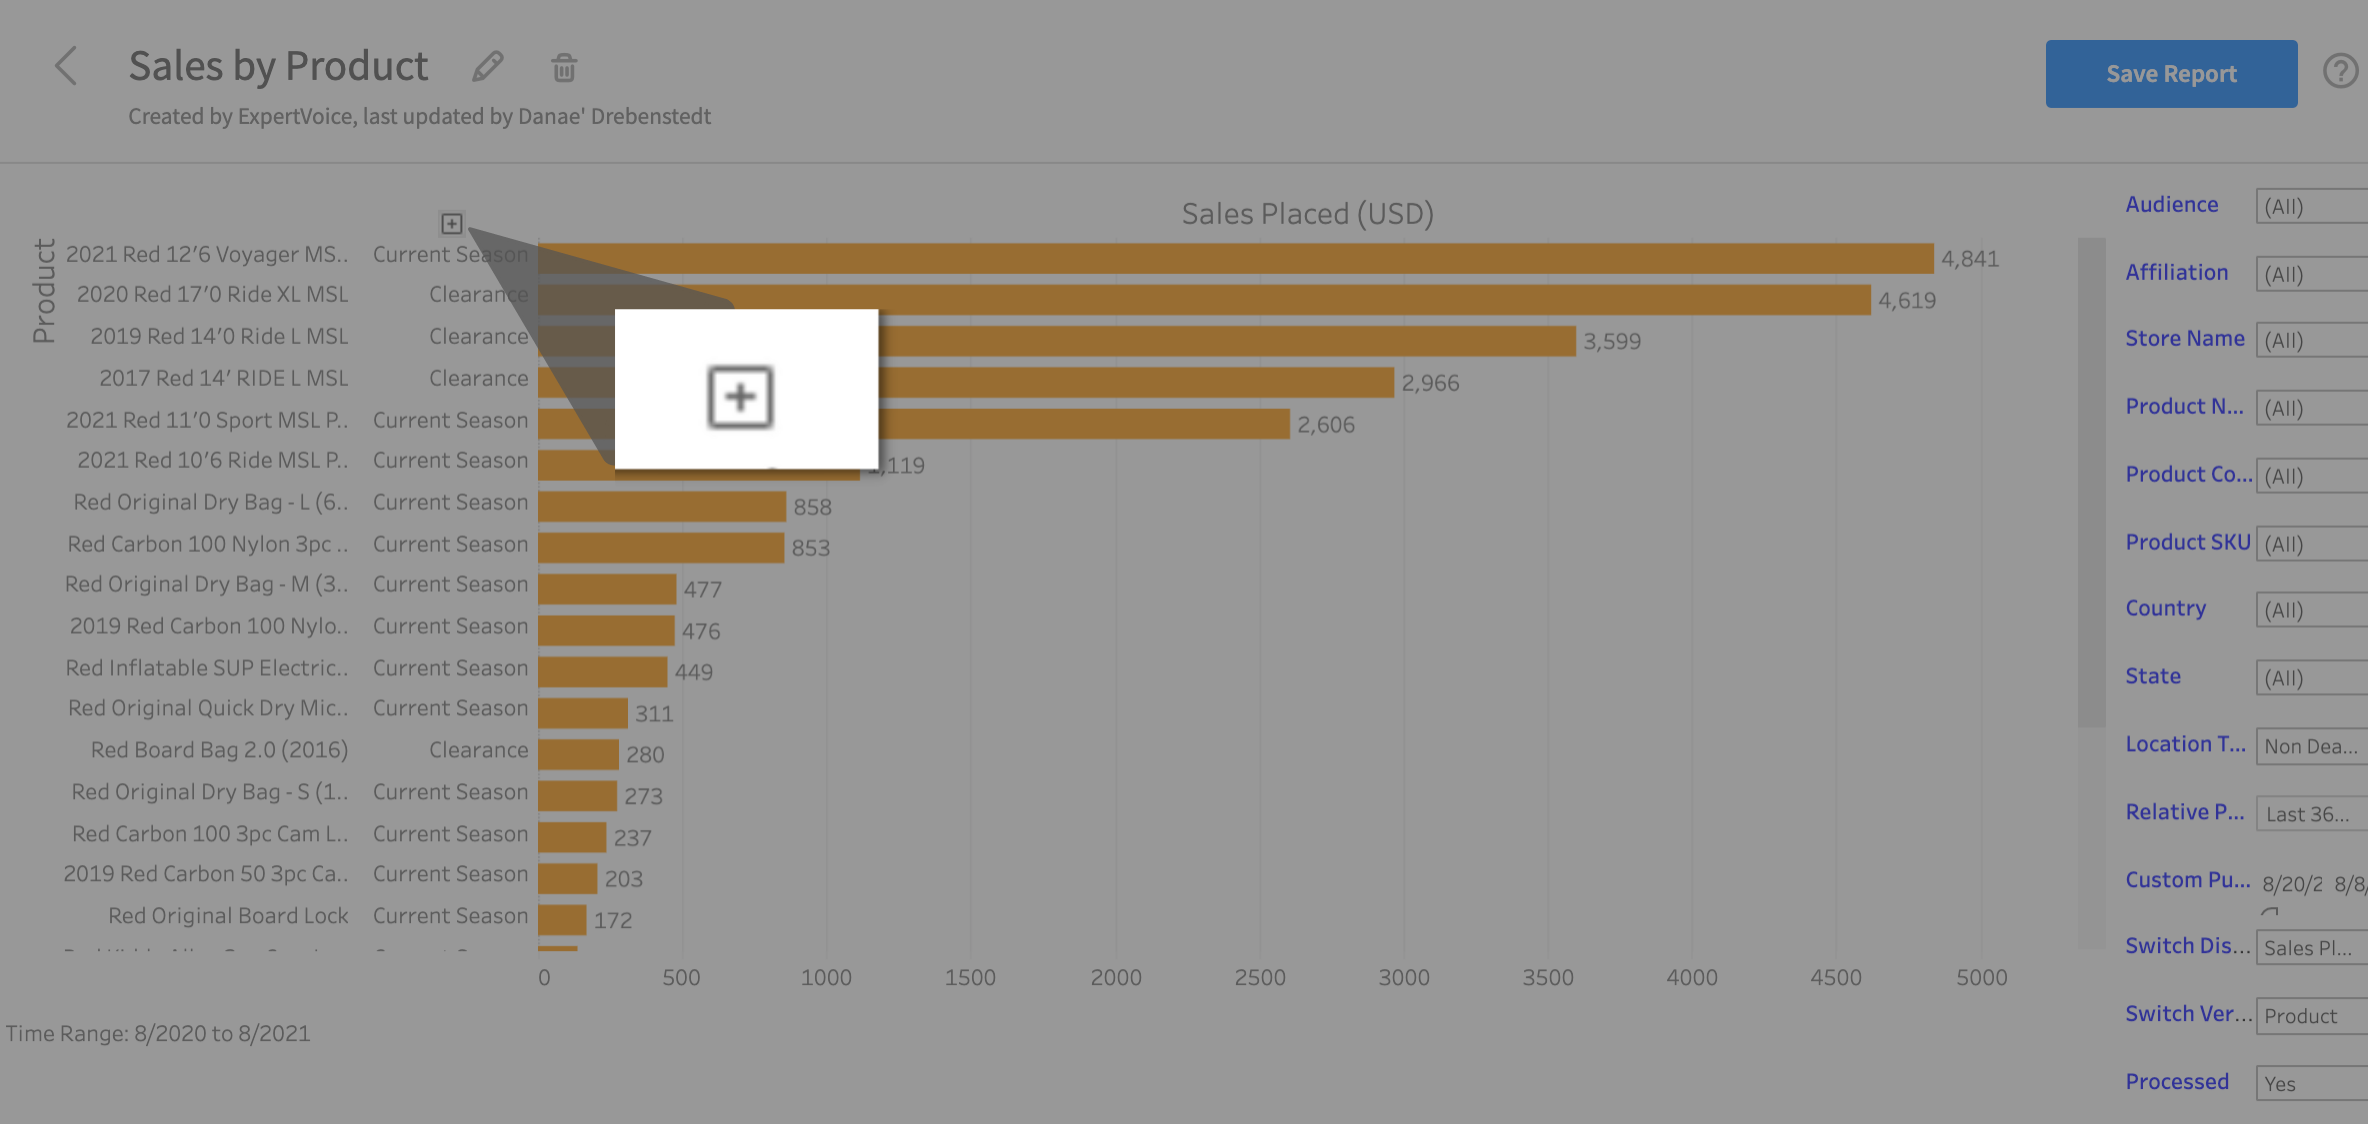
- You can drill down the data to view your total sales and units sold for specific product names, codes, and SKUs.
- You can also click to expand or hide the data columns available to you by clicking the [+] or [-] icon at the top of the report.
Who this impacts: Brands with a hosted store or product catalog on ExpertVoice.
Why it matters: You have better visibility into your most purchased and least purchased products on ExpertVoice.
Where you can find it: In Analytics, open the Sales by Product report and use the new menu filters on the right-hand side to update the bar graph data:
- Switch Display Metric: You can now select Product Units Sold, Sales Placed (USD), or Orders Volume.
- Product Name: Select one or multiple product names.
- Product Code: Select one or multiple product codes.
- Product SKU: Select one or multiple product SKUs.
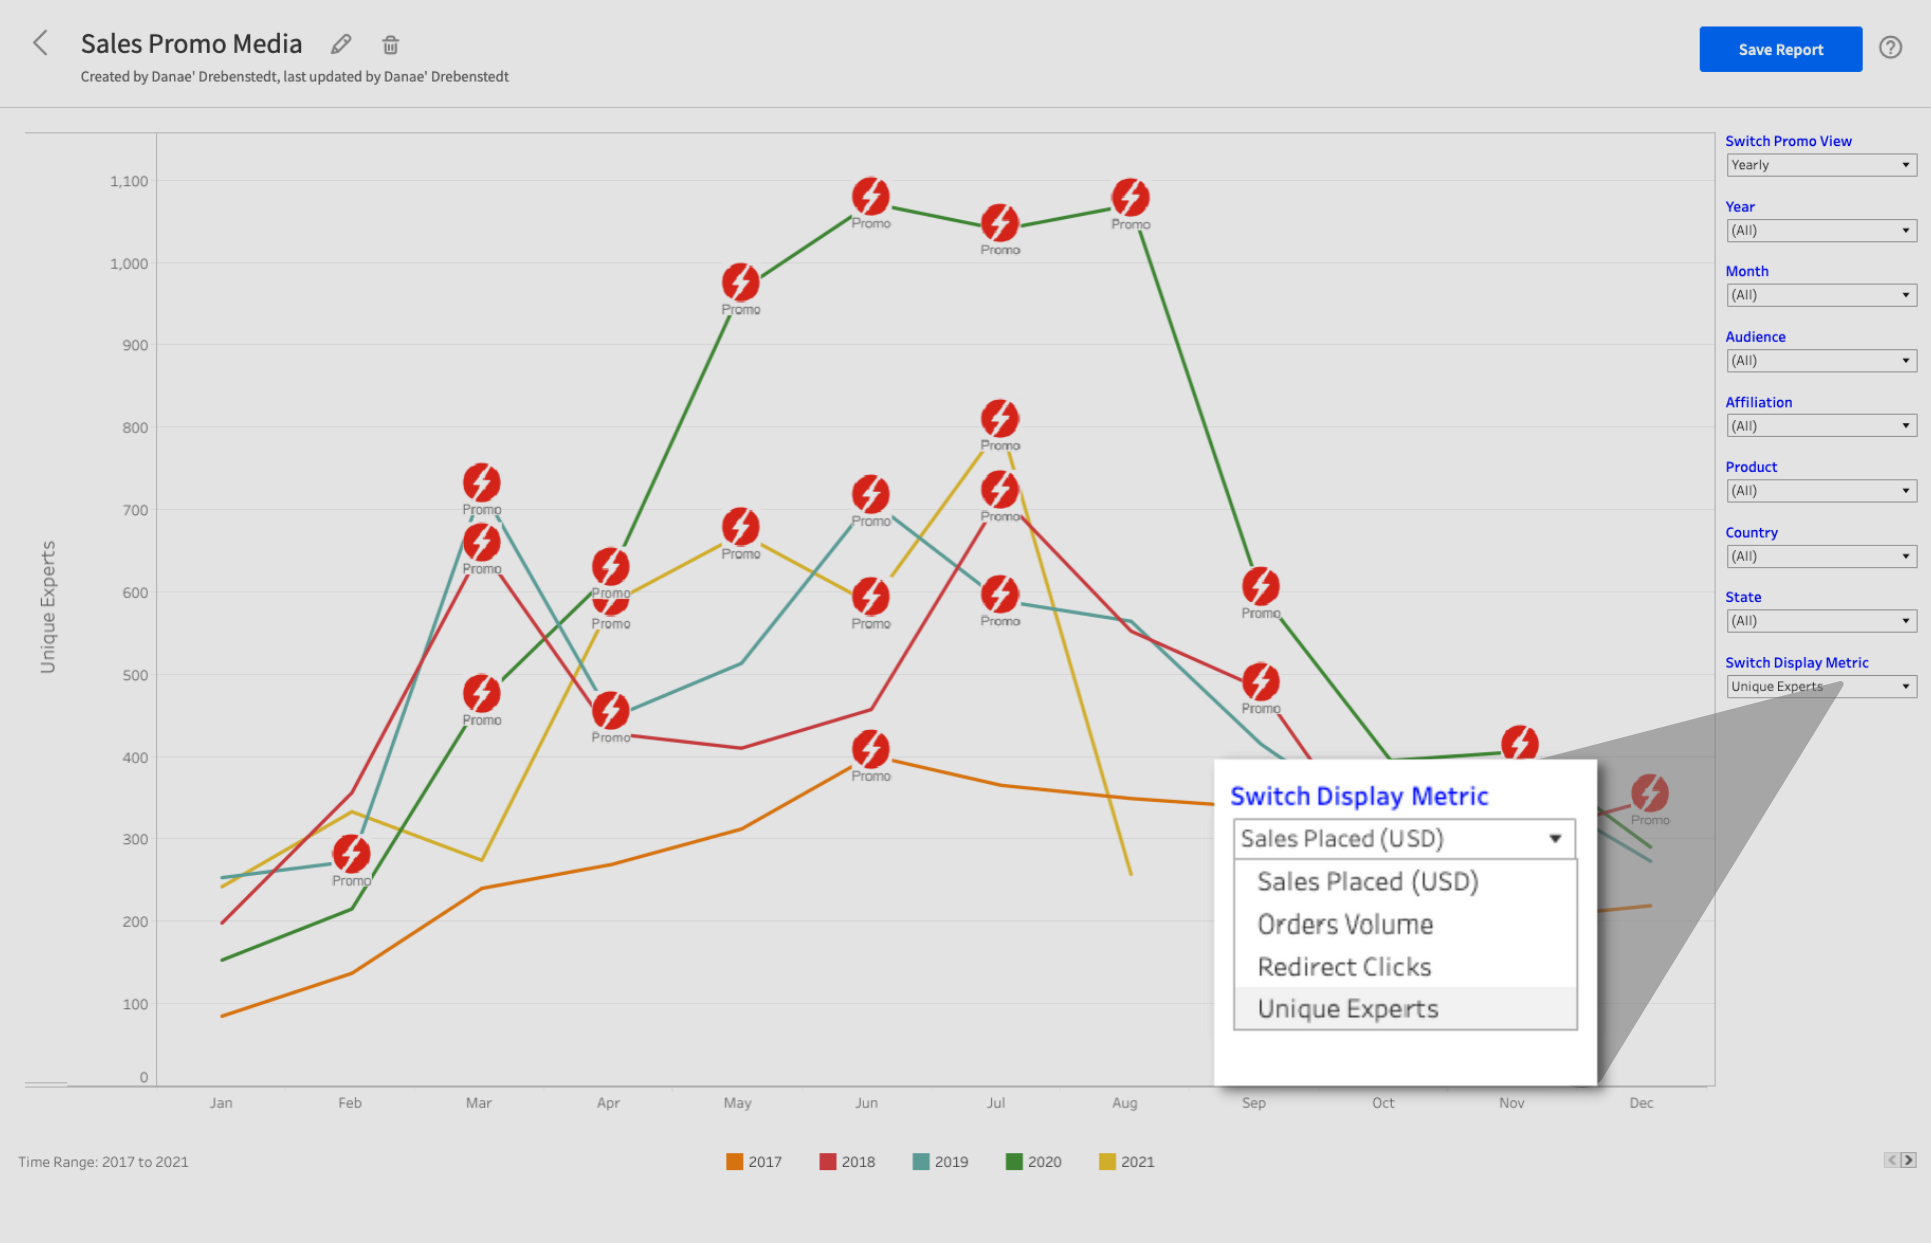
Sales Promo Media Report
What it is: You can now filter the Sales Promo Media report in the Advocacy Platform to view the total number of unique experts who place an order during your promotion on ExpertVoice.
Who this impacts: Brands who participate in promotional media.
Why it matters: You now have a more efficient way to view how many total unique experts purchase your product(s) before, during, and after your promotion.
Where you can find it: In the Analytics App, open the Sales Promo Media report. You'll see Switch Display Metric with a dropdown of various filters on the right-hand menu. Select Unique Experts to update the data in the graph.
For more information, don't hesitate to get in touch with your Customer Success partner.
Similar articles: