New Versus Returning Experts Report in Analytics
New Versus Returning Experts Report in Analytics
By Shannon May
Product Marketing Manager at ExpertVoice
December 20, 2021
New Versus Returning Experts Report
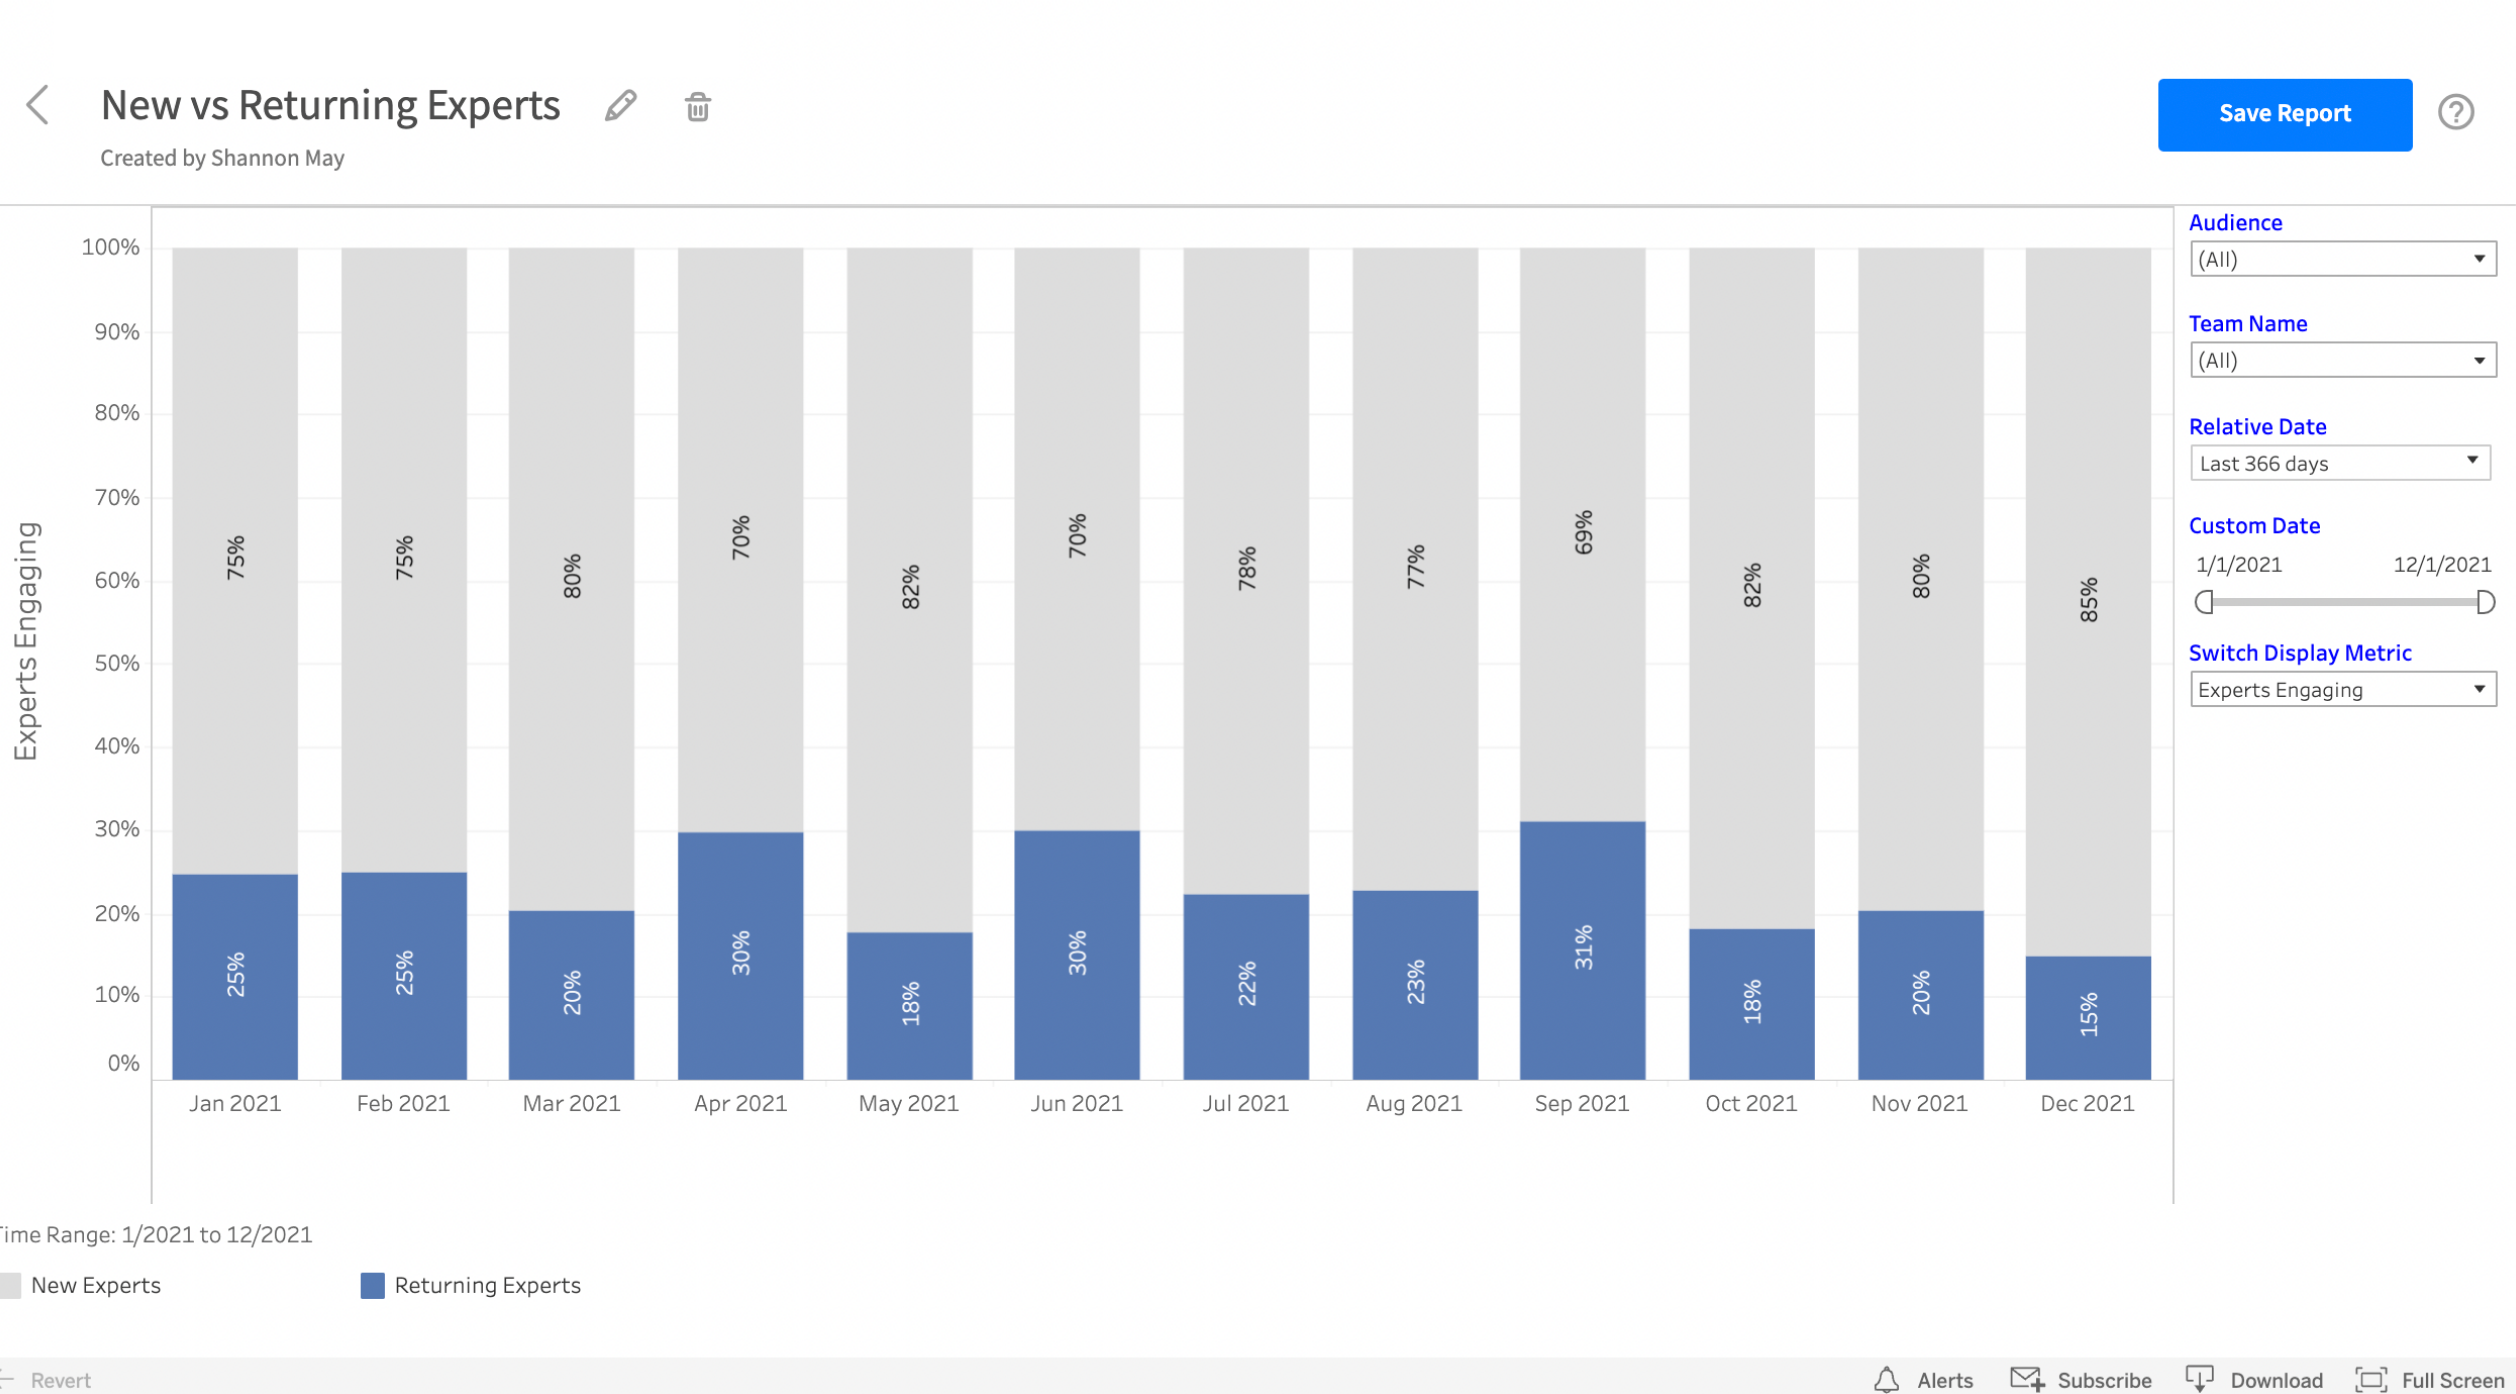
What it is: The New vs. Returning Experts Report is the best way to track your brand's expert acquisition and retention efforts over time. The report shows you the ratio of how many new experts engage with your brand's lessons, products, and store compared to experts who previously engaged with your brand.
- You can easily compare the data by month and see how this ratio changes throughout the year.
- You can use tools in the report to download it as a CSV file, image, PDF, or Tableau workbook, create a report alert, or subscribe to the report to receive it in a reoccurring email.
Why it matters: After your program launches, this data brings transparency to the expert journey and can help inform your advocacy marketing strategy.
For example, if your goal is to reach a 40% retention rate of experts returning to your campaigns each month, but only 20% come from returning experts, you could create a more steady drumbeat of new campaigns and promotions on ExpertVoice.
Returning experts are typically your most influential brand advocates, and they refer friends and family to your business and have 22x more conversations about buying than the average consumer.* In addition, it's easier to convince returning experts to engage with your brand again, and the longer they stay with you, the greater their lifetime value becomes.
Who it's for: Brands with the Advocacy Platform subscription.
Where you can find it:
- Log in to the Advocacy Platform using your ExpertVoice credentials.
- Click Analytics in your left-hand navigation.
- Click Add Reports to Dashboard.
- Select the New vs. Returning Experts report and then drag and drop it to your dashboard.
For more information, please get in touch with your Customer Success partner.
*Source: Keller Fay Group Research Study
Similar articles: