Click on the topic of interest below to jump directly to more information about the newest reports and updates available in the Advocacy Platform.
- NEW REPORT: Historical Sales and Educational trends (ability to see sales or education engagement month over month or year over year)
- NEW REPORT: Promotional Media Impact (ability to see how your investment in promotional media impacted sales or engagement with your educational modules)
- NEW FEATURE: Filter reports by dealer list
- NEW FEATURE: View engagement down to the individual expert at each retail location
The Analytics app inside the advocacy platform now offers four new reports to help you better understand your program performance. The new offerings include historical performance for sales and education, providing you easier year over year comparisons as well as a report that shows the impact of your promotional media campaigns. Each of these reports is available by clicking “Add Reports to Dashboard”, scrolling to the desired report and dragging the report to your dashboard. Go check it out now, or keep reading for a deeper dive along with some tips and tricks.
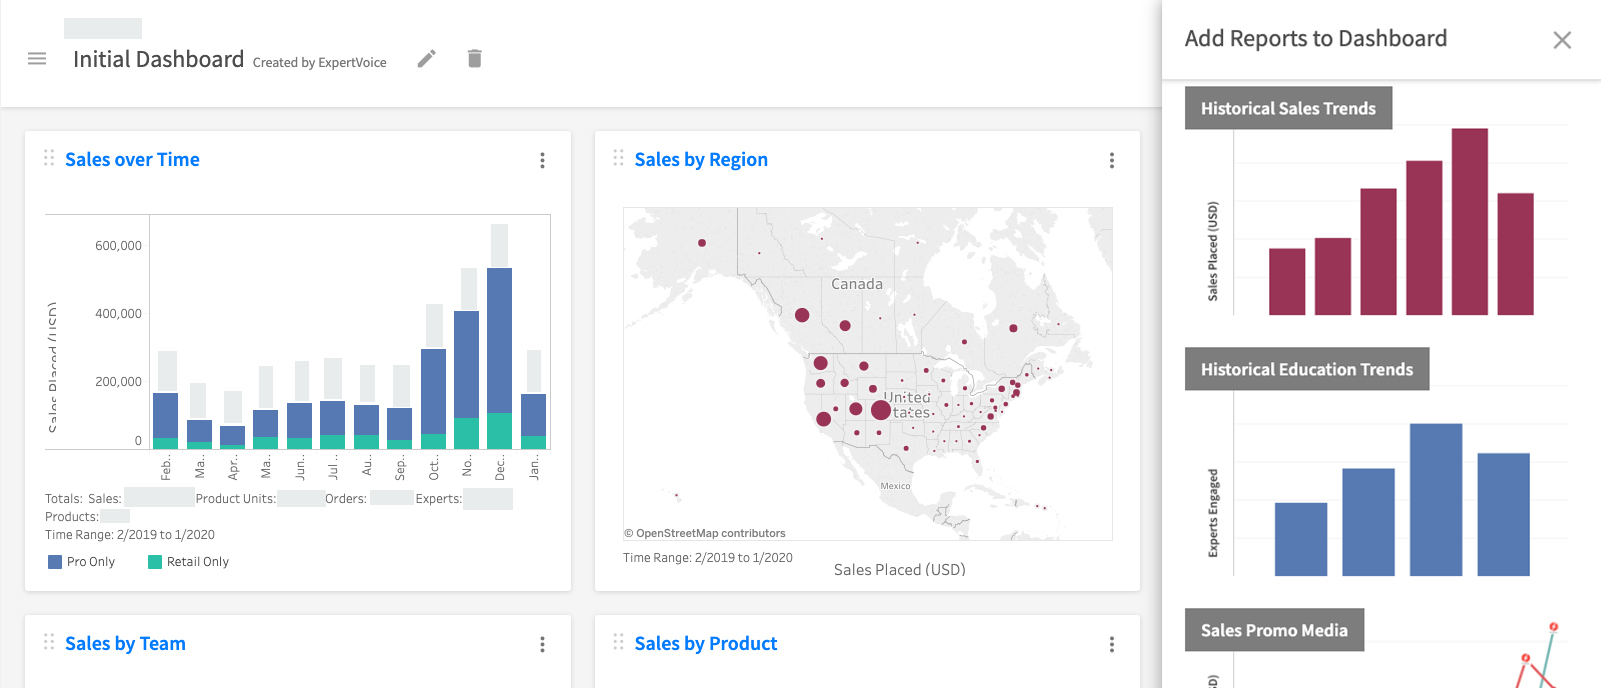
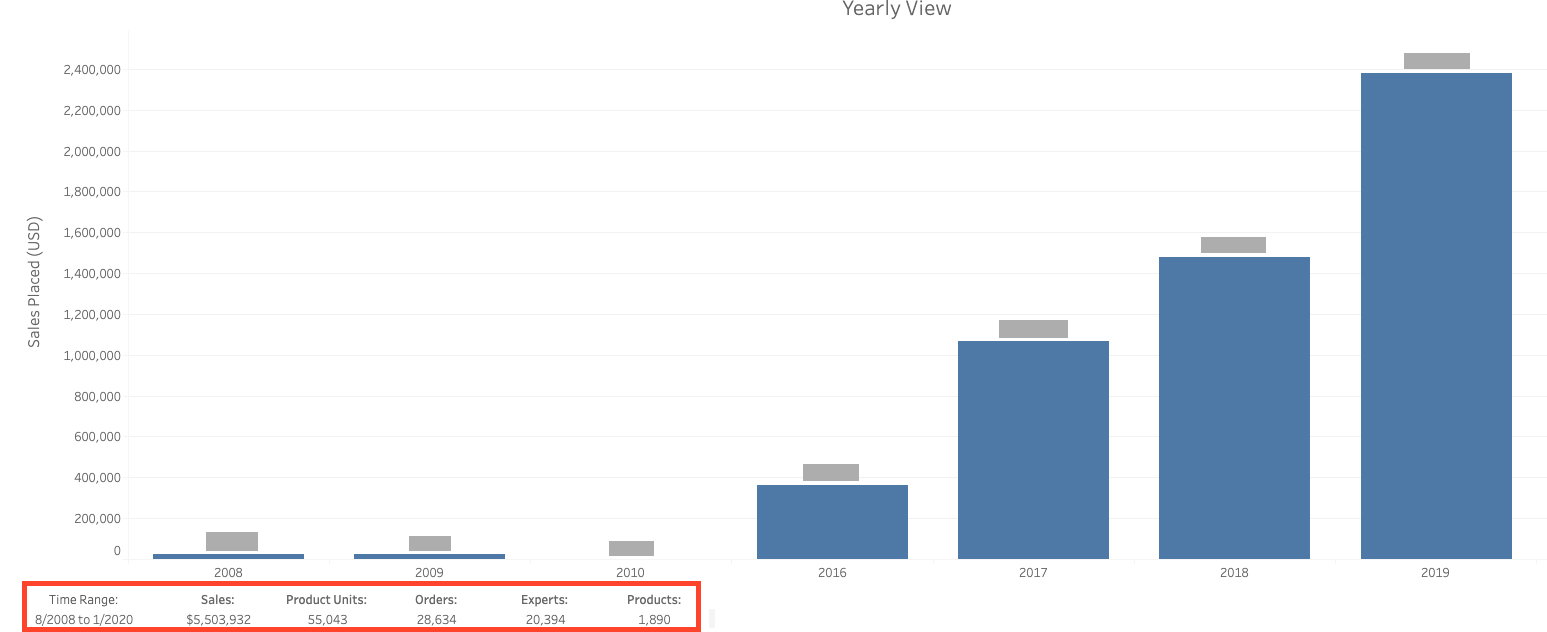
NEW REPORT: HISTORICAL SALES TRENDS | HISTORICAL EDUCATIONAL TRENDS
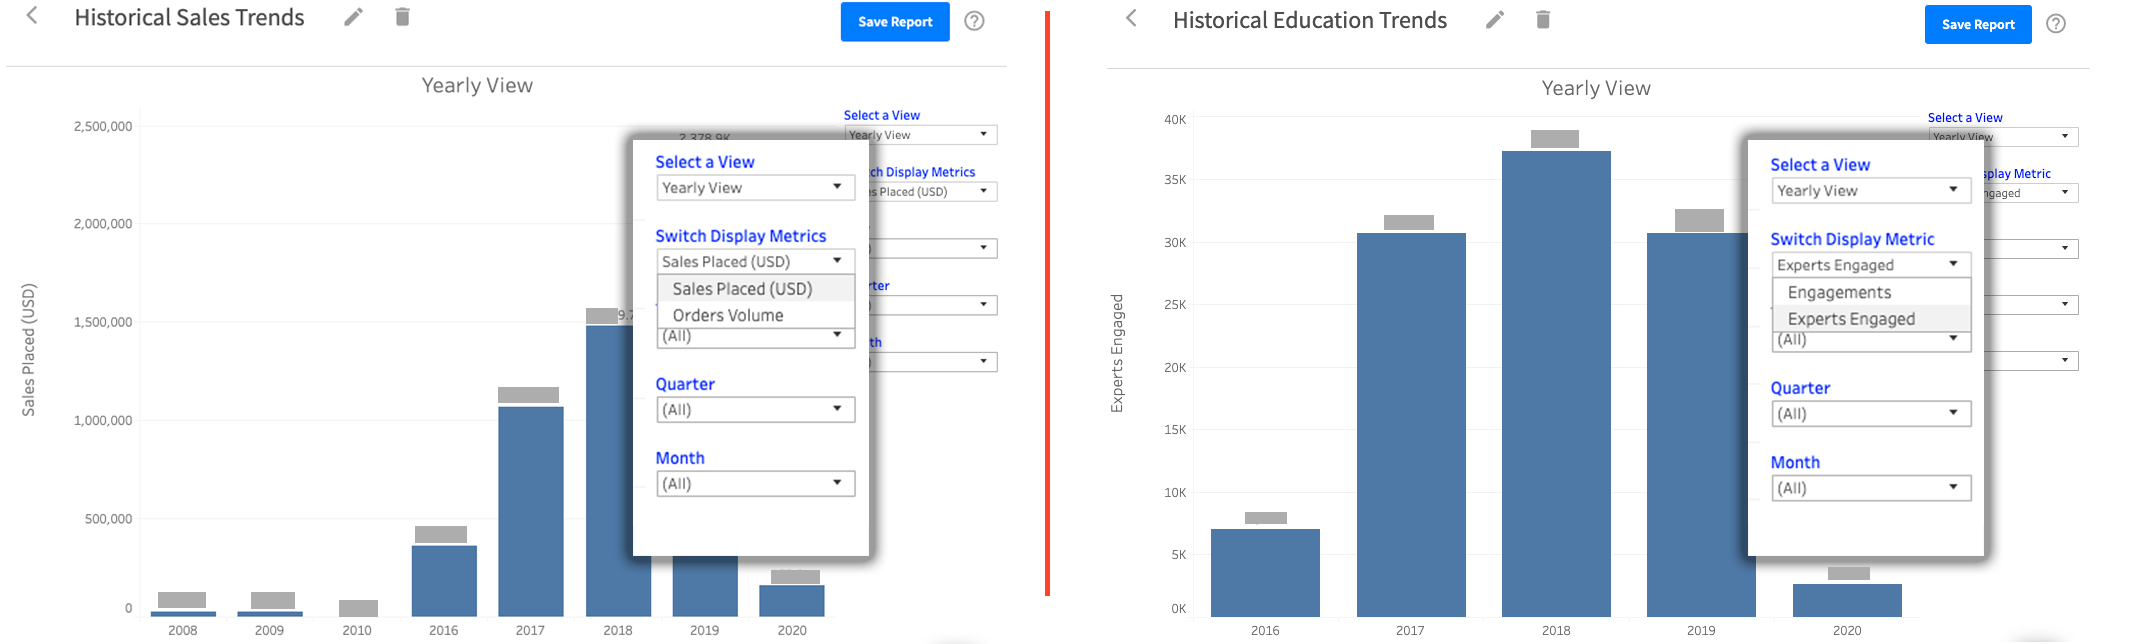
The functionality in these two new reports is very similar. Sales trends shows all sales placed in your ExpertVoice hosted store per month while educational trends shows engagement with your ExpertVoice modules per month.
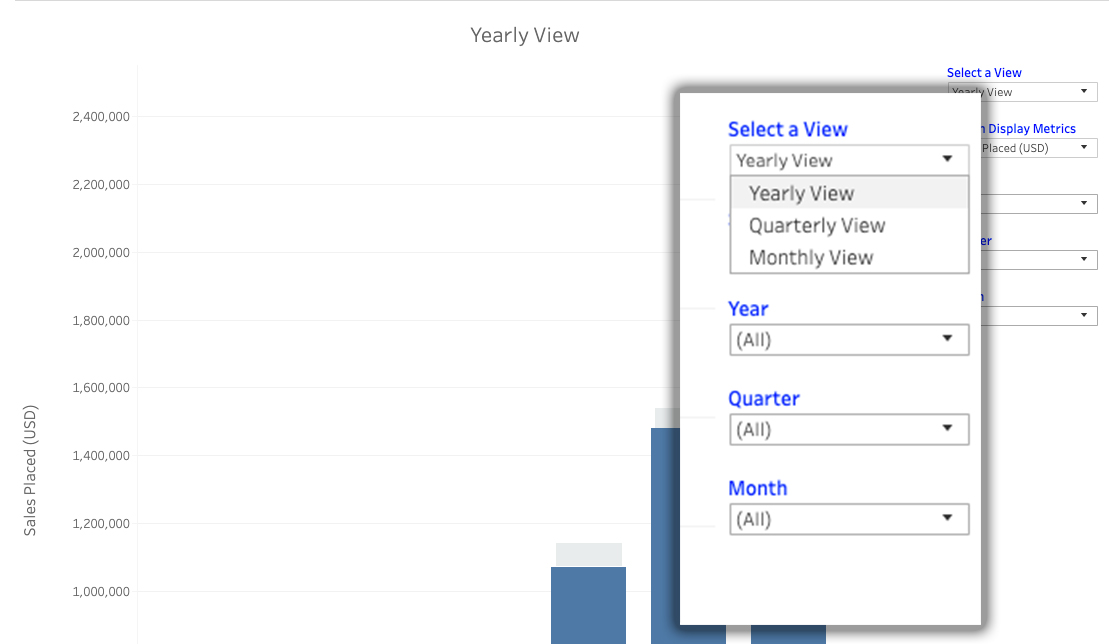
In both reports, the time frame on the X-axis can be adjusted to compare sales or education year over year, quarter over quarter OR month over month.
In the Historical Sales Trends, you can adjust the Y-axis to show either the total dollar value of orders placed, or to reflect the total number of orders placed. Conversely, in the Educational Sales Trends report, the Y-axis can be adjusted to show either the total number of experts engaged OR the total number of engagements.
In both reports, details surrounding year over year (or quarter or month) comparisons can easily be seen by hovering over the data of interest:
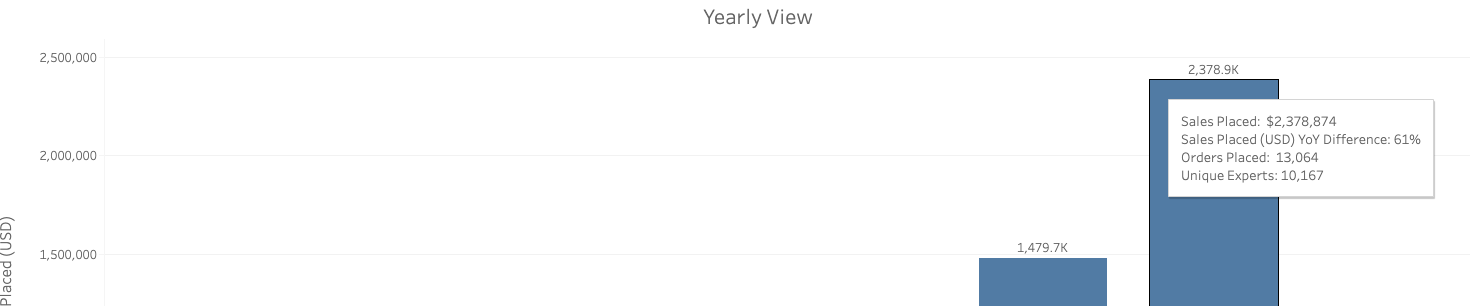
As with any report, you can create duplicate versions of it in the event you wanted to see year over year sales dollars vs. order volume side by side or trends throughout the year and then how they look by month as well. Lastly, both reports show a running total for the time frame you are viewing along the bottom of the report.
NEW REPORT: PROMO MEDIA IMPACT – EDUCATION AND SALES
The promotional media reports highlight events where you invested in a promotional media campaign, allowing you to quickly see the impact it had on experts engaging and/or experts ordering.
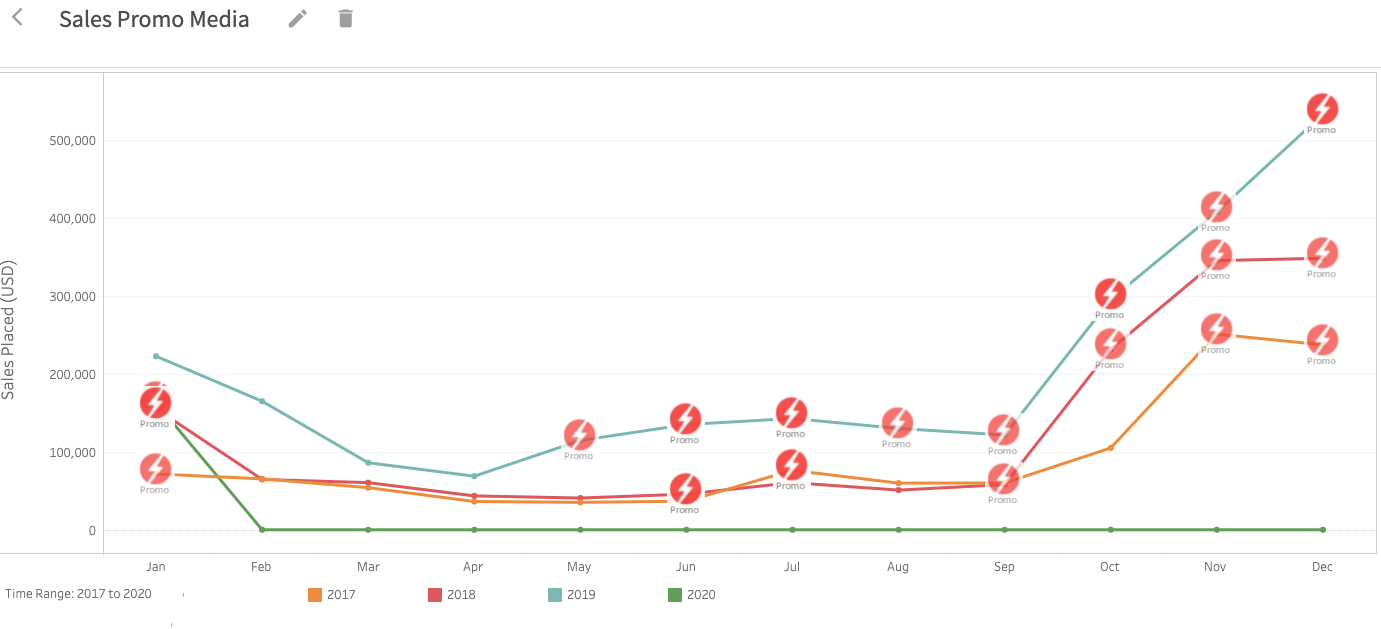
A robust set of filters are available for this report, allowing you to compare multiple years or to focus on one single year. Other filters available include:
- Audience: Toggle between Retail & Pro to see the impact of your campaigns for each audience
- Affiliation: Did you target a specific subset of your audience with a particular campaign? If so, you can drill down to see how performance was affected within a particular group or groups.
- Module: This allows you to select unique modules or lessons to see if media impacted one module more or less than another.
- Country/State: Both of these filters provide a view into how media engaged your audience in certain geographic areas, so you could easily compare the east vs. the west or see what resonates in Montana vs. North Carolina.
As with the historical trends reports, you can also adjust the Y-Axis to reflect total engagements OR experts engaged in the Education Media report. In the Sales Media report, you can adjust to see total dollars sold OR total orders placed.
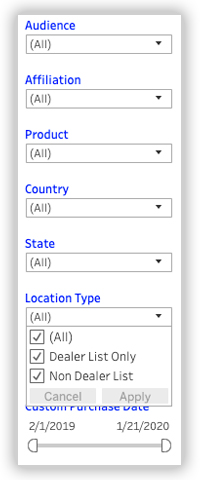
NEW FEATURE: FILTER BY DEALER LIST
A new filter has been added to all reports inside the Analytics app, which allows you to limit the view to only display experts who are part of your dealer list, to display experts who are NOT part of your dealer list, or to display ALL experts.
What’s a Dealer List? These are the retail doors that carry or distribute your product – you may refer to it as your Retailer List, Distributor List, Sell-through or Sell-in List.
To apply the filter, simply click into the Location Type filter, select your desired audience and click “Apply.”
NEW FEATURE: ENGAGEMENT BY RETAILER AND EXPERT
When viewing either the Education by Team or Sales by Team reports, you can now drill down deeper into each report to gain greater insight into who from those teams are engaging with your store or lessons. This new level of detail provides you greater insight into where reps are reaching associates, where your brand might need additional support and also provides you the information you need to quickly reward stores and associates for engaging with your brand (if you so choose).
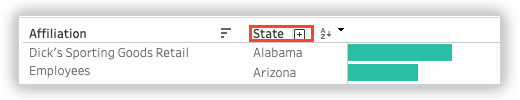
In the example here, if you hover over “Affiliations” in the upper left corner, you will see a plus (+) sign appear.
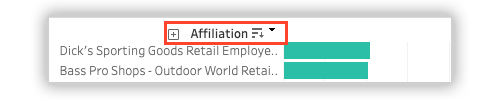
Simply click in the (+) and the report will drop into a view by state for each retailer you have selected to view.
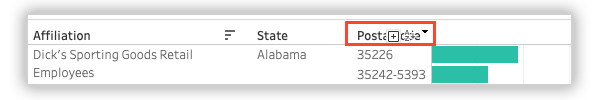
From this view, you can drill down again by hovering over the “state” header and clicking on the plus sign again. Now you can see the postal codes (or zip codes if that’s what you like to call them) for each of your retail locations where experts have engaged.
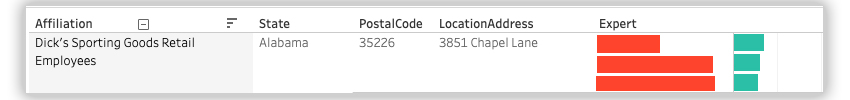
But we’re not done yet, if you need the addresses for your stores in that zip code, simply click on the plus sign again to reveal exact store location. One last click over LocationAddress will reveal the names of all experts engaging at each location (except we hid the names for demonstration purposes in this blog post).
We hope these new reports provide you deeper insights into your program performance. If you have other suggestions or requests, please send an email to our Director of Product Marketing, Becky Lyttle at becky.lyttle@expertvoice.com .